Why Large OpenTelemetry Collector Binary Size Increases Memory Usage (And Why It's Not As Bad As It Looks)
This is a written version of a phenomenon I have known about for quite some time, and explained in verbal form in direct conversation and in a couple public talks. The need has come up a few times now to directly reference the details of this phenomenon, but linking out to YouTube links with timestamps where I (often clunkily) verbally explain the issue doesn’t feel great. That’s why I’m putting together this quick post to demonstrate the problem and explain the deeper details.
Experiment
To set this up I spun up a plain Debian VM and downloaded otelcol-contrib and otelcol from opentelemetry-collector-releases, both from the recent v0.145.0 release. If you’re not familiar with how these distributions are put together, they are actually built from the exact same upstream Collector library and component code. The only difference between them is the components included; otelcol-contrib contains every component available in the opentelemetry-collector and opentelemetry-collector-contrib repositories.
I ran the two collectors at the same time on my machine, using this config in each (technically two copies of it with modified port numbers in each so they could run simultaneously). If you’re following along, the command I used to run the collector in the background with redirected output was ./otelcol-contrib --config config.yaml > output.log 2>&1 & (and same with otelcol but using config2.yaml and output2.log).
Once these were both running, I checked htop, pressing F4 with the filter otelcol so we can look at both processes. I got the following result:
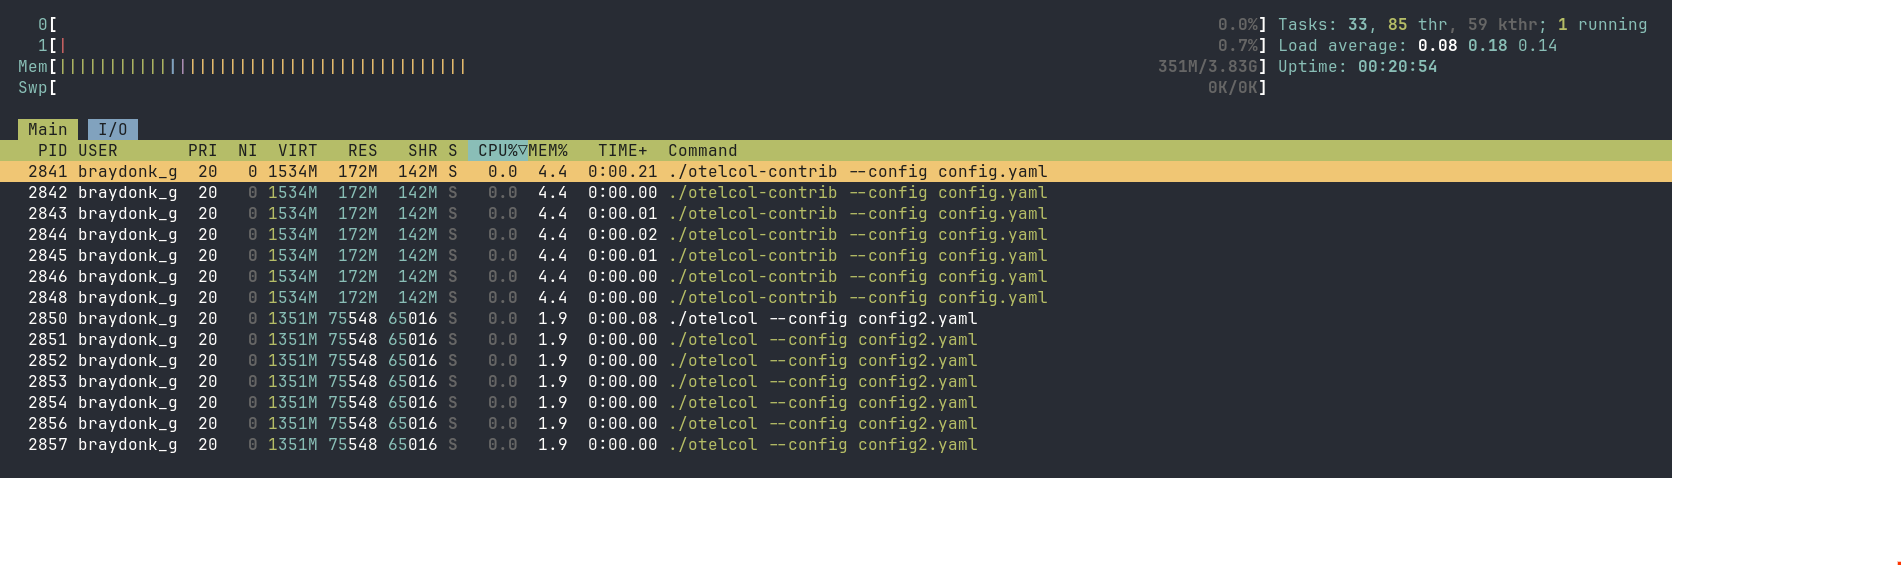
otelcol-contrib is using 4.4% of system memory, with otelcol only using 1.9%, basically half. The RES and SHR values for each of these processes reflects that difference directly. Why is it that two processes largely built from the same code, running the same codepaths since they are on the same config, have such a large amount of difference in memory usage?
Investigating System-level Process Memory Usage
Usually if I was investigating memory performance of a Go program, I would start with pprof. I’ve done this investigation before, so I know it’s actually less interesting to start with direct profiling. If you want to see that analysis see the Optional Colour section pprof heap analysis (though you may want to read the rest of the article first).
Looking at /proc/[pid]/status
So for starters, we’ll dive into more general Linux process memory statistics. We can start with /proc/[pid]/status to look at the memory values. The values in this file are often victim of approximation that makes the values slightly inaccurate, but we can still gather the trend of important numbers from it:
$ cat /proc/$(pidof otelcol-contrib)/status
Name:   otelcol-contrib
...
VmPeak:  1571824 kB
VmSize:  1571824 kB
VmLck:         0 kB
VmPin:         0 kB
VmHWM:    177340 kB
VmRSS:    177340 kB
RssAnon:           30976 kB
RssFile:          146364 kB
RssShmem:              0 kB
Explaining the rows of interest:
VmSize: This is the amount of virtual address space requested by the process. This is not a reflection of actual memory in use by the process, rather the virtual address space it has requested from the kernel. This is very high, but it’s not terribly controversial in my purposely contrived example. Go’s memory manager will always request hefty amounts of virtual address space.VmRSS: RSS is short for “Resident Set Size”. This means it’s the amount of actual space in RAM the process is currently using. This is the same as theREScolumn inhtop. It is the primary number where we see a large gap betweenotelcol-contribandotelcol. However, RSS doesn’t just mean “memory the program has allocated”. A process in Linux needs space in RAM for more things than just application memory, such as (crucially) executable code and data from the binary itself. More on this later.RssAnon: This usually is a better indication of memory used by the process that were requested by application code or operation in some way. There are some cases where anonymous mappings aren’t just standard heap allocations from the program, but in our case these anonymous mappings are taken up a fair bit by Go runtime heap allocations.RssFile: This an indication of how much of the space in RAM is taken up by data backed by files. If a process needs to read data from a file on disk, it will request memory from the kernel to hold while there’s available memory space to allow for reading that data directly from RAM instead of having to go out to disk every time. This is called “memory mapping” the file (read more atman mmap). As we can see, this is a large portion of the overall resident set size ofotelcol-contribcurrently.RssShmem: This is an account of how much of the resident set size the process is holding is shared by other processes in RAM. In our case, none of the memory held byotelcol-contribis shareable. This is quite typical of non-CGO Go binaries. It’s all statically linked, meaning all the data that it loads to actually load the binary into memory is only usable by the process itself. This is unlike a typical C program for example, which will almost certainly share aglibcmapping that all other C programs on the system are sharing.
With this context in mind, let’s go check on otelcol’s status file for comparison:
$ cat /proc/$(pidof otelcol)/status
Name:   otelcol
...
VmPeak:  1384144 kB
VmSize:  1384144 kB
VmLck:         0 kB
VmPin:         0 kB
VmHWM:     83520 kB
VmRSS:     83520 kB
RssAnon:           16656 kB
RssFile:           66864 kB
RssShmem:              0 kB
Let’s compare the relevant rows:
VmSize: Lower, but is not a super important difference for reasons I stated above.VmRSS,RssAnon,RssFile: Lower, essentially taking up less than half space in RAM thatotelcol-contribis.RssShmem: Also 0 as expected, meaning none of the mappings here can be shared between any processes, and there’s no shenanigans like double-counting shared memory between running Collectors or anything; all pages of memory held by each Collector process are completely private.
Looking at Memory Map
The next step is to look into the direct details of the actual memory mappings of each process. We can get detailed information about all mappings through /proc/[pid]/smaps, but that information is actually a bit more detailed than what we need right now. Instead, we’ll use pmap(1), a utility that gives us a simplified view of a process’ memory map.
Starting with otelcol-contrib again:
$ pmap -x $(pidof otelcol-contrib)
6962:   ./otelcol-contrib --config config.yaml
Address           Kbytes     RSS   Dirty Mode  Mapping
0000000000400000  155076   72576       0 r-x-- otelcol-contrib
0000000009b71000  182424   79268       0 r---- otelcol-contrib
0000000014d97000    5560    4500     796 rw--- otelcol-contrib
0000000015305000     632     400     400 rw---   [ anon ]
000000c000000000   28672   28672   28672 rw---   [ anon ]
000000c001c00000   36864       0       0 -----   [ anon ]
00007f821bba0000     832     580     580 rw---   [ anon ]
00007f821bc80000      64       4       4 rw---   [ anon ]
00007f821bc94000    3968    3612    3612 rw---   [ anon ]
00007f821c074000    1024       4       4 rw---   [ anon ]
00007f821c174000      72      36      36 rw---   [ anon ]
00007f821c186000   32768       4       4 rw---   [ anon ]
00007f821e186000  263680       0       0 -----   [ anon ]
00007f822e306000       4       4       4 rw---   [ anon ]
00007f822e307000  524284       0       0 -----   [ anon ]
00007f824e306000       4       4       4 rw---   [ anon ]
00007f824e307000  293564       0       0 -----   [ anon ]
00007f82601b6000       4       4       4 rw---   [ anon ]
00007f82601b7000   36692       0       0 -----   [ anon ]
00007f826258c000       4       4       4 rw---   [ anon ]
00007f826258d000    4580       0       0 -----   [ anon ]
00007f8262a06000       4       4       4 rw---   [ anon ]
00007f8262a07000     508       0       0 -----   [ anon ]
00007f8262a86000     384      84      84 rw---   [ anon ]
00007fffabf3d000     132      16      16 rw---   [ stack ]
00007fffabfc5000      16       0       0 r----   [ anon ]
00007fffabfc9000       8       4       0 r-x--   [ anon ]
---------------- ------- ------- -------
total kB         1571824  189780   34228
The first 3 mappings are standard for basically any ELF binary. These mappings are all named with otelcol-contrib, meaning these are mappings backed by a file called otelcol-contrib which we know for a fact is the binary that this process is running. As we can see, a large portion of the overall RSS of our process is clearly coming from these mappings. I’ll discuss what these mappings actually mean in Optional Colour under ELF Binary Structure. For now, let’s simply take the point that these file-backed mappings take a large amount of the RSS of the overall process.
Let’s check this in otelcol:
$ pmap -x $(pidof otelcol)
8700:   ./otelcol --config config2.yaml
Address           Kbytes     RSS   Dirty Mode  Mapping
0000000000400000   79536   31340       0 r-x-- otelcol
00000000051ac000   73972   36104       0 r---- otelcol
00000000099e9000    2684    1824     376 rw--- otelcol
0000000009c88000     460     252     252 rw---   [ anon ]
000000c000000000   12288   12288   12288 rw---   [ anon ]
000000c000c00000   53248       0       0 -----   [ anon ]
00007f4007636000    4224    3720    3720 rw---   [ anon ]
00007f4007a56000    1024       4       4 rw---   [ anon ]
00007f4007b56000      72      20      20 rw---   [ anon ]
00007f4007b68000   32768       4       4 rw---   [ anon ]
00007f4009b68000  263680       0       0 -----   [ anon ]
00007f4019ce8000       4       4       4 rw---   [ anon ]
00007f4019ce9000  524284       0       0 -----   [ anon ]
00007f4039ce8000       4       4       4 rw---   [ anon ]
00007f4039ce9000  293564       0       0 -----   [ anon ]
00007f404bb98000       4       4       4 rw---   [ anon ]
00007f404bb99000   36692       0       0 -----   [ anon ]
00007f404df6e000       4       4       4 rw---   [ anon ]
00007f404df6f000    4580       0       0 -----   [ anon ]
00007f404e3e8000       4       4       4 rw---   [ anon ]
00007f404e3e9000     508       0       0 -----   [ anon ]
00007f404e468000     384      72      72 rw---   [ anon ]
00007fffbd111000     132      16      16 rw---   [ stack ]
00007fffbd1f3000      16       0       0 r----   [ anon ]
00007fffbd1f7000       8       4       0 r-x--   [ anon ]
---------------- ------- ------- -------
total kB         1384144   85668   16772
The actual structure of the mappings is almost identical as expected. We can see the file-backed mappings from the binary for the process (otelcol this time). A majority of the RSS is contributed once again by the binary mappings. However, they are much smaller in the otelcol process than the otelcol-contrib process.
This primarily demonstrates that the largest difference between the amount of space these two processes currently resides in RAM is the size of the root Collector binary. However, that exact choice of words is very deliberate.
What does RSS really tell us?
The only piece of information we know for sure when we look at an RSS value is the amount of bytes of RAM this process is currently taking up. Our model of this is slightly simplified due to the fact that our process is not sharing any of its memory with any other processes, whereass if we were we’d have to take into account the amount of RSS that our process takes up but shares with others (you can look at things like Proportional Set Size which will account for shared memory, but that isn’t necessary in this scenario). Overall though, knowing how much memory our process presently takes up in RAM is a really simplistic view of reality.
When a process wants memory, the Kernel will allocate space for it in a unit called a page. On Linux systems this is generally 4096 bytes, or 4KiB (you can check for sure on your system with getconf PAGESIZE). If you’re new to this concept and didn’t understand what I meant when I used the term “page” earlier in the post, now you know what I mean. :)
When the kernel allocates a page requested by the process, various things are taken into account such as whether the page is private or shared (in our case, all pages we are concerned with are private), whether the page is backed by some data readable from the disk, whether it is something special like page cache etc. All of this is to determine whether a page can be considered “reclaimable” by the kernel. User-space processes, drivers, or even kernel operations may be holding a lot of pages in RAM at a given time, and if a system is not under memory pressure, then the process might as well keep the pages in RAM because presumably these pages were useful for somebody at some point. However, once the system is under some manner of memory pressure, the kernel will do some work to reclaim the least important pages held in RAM at the moment to satisfy new requests.
I bring all of this up to say that some of the first pages to go in a high pressure reclaim scenario are often file-backed memory mappings. The first consideration is generally any inactive clean pages, but after taking an account of the LRU pages file-backed pages are preferred. An anonymous memory mapping is less preferred in part because if the page is dirty (aka has been written to) it needs to be written to swap-space on disk before the page can be reclaimed, otherwise the data would be lost. A read-only file-backed mapping is always clean and thus doesn’t have this restriction, as the data is readily available it can simply be read from disk again if it’s needed.
While file-backed mappings are preferred, the reclaim still happens in a least-recently-used manner. Pages that are heavily actively referenced won’t be reclaimed as readily as dead pages. The otelcol(-contrib) file backed pages will be considerably active since they are constantly read for the process’s operation, but it doesn’t mean they aren’t reclaimable when push comes to shove. So while at time of checking we found that the first mapping of otelcol-contrib is taking 72576 bytes of RSS, that doesn’t mean many of its pages won’t be reclaimed in a memory pressure scenario.
That means that just looking at RSS doesn’t always paint a full picture of what matters in our process’s memory usage. The OOM (Out Of Memory) Killer is one of the biggest things you want to avoid, but a high RSS doesn’t necessarily mean you need to fear the OOM Killer yet; the OOM Killer will kill a process specifically when it is unable to reclaim enough space to fill a memory request. That is to say that it will first do everything it can to reclaim enough pages of memory to satisfy the new allocation request before OOM Killing a process.
Since I imagine the primary audience here is observability-minded folks, so let’s tie this back to observability for those who haven’t long since dropped off the article. Obviously the fresh VM I used for this experiment is experiencing essentially no memory pressure and can very easily satisfy memory requests for the foreseeable future, but even if we were getting tight, I might be getting worried about my collector by looking at the higher RSS value. If I’m looking at the memory usage of my system, and RSS as my primary per-process memory metric, I might consider the Collector to be contributing to some significant portion of that memory pressure at a glance. But RSS is a cumulative measurement that often measures a lot of reclaimable pages. The RSS itself could still be bad; since it’s also measuring dirty anonymous memory mappings, a consistently rising RSS can still indicate a memory leak in the actual program, and a process with a lot of RSS in a high memory pressure system may be not at risk of being killed but still at risk of causing heavy page thrashing for the system. However we can’t actually grasp the true nature of a given process’ memory usage and what effect it has on our whole system just by its RSS value, and in the case of my contrived example the high RSS is not such a big risk because we know how much of RSS is presently taken up by file-backed pages.
Note on cgroups
The Collector is often not running as a standalone process like this. Typically it will be running under a cgroup, either as a systemd service or as a container image. A cgroup itself can have a local memory limit. The page reclaim behaviour that I explained in the previous section when the entire system is under memory pressure also applies to when a cgroup is locally hitting its memory limit. However the page reclaim doesn’t occur on the whole system, only locally on the pages owned by the cgroup.
Conclusion
It still helps to keep Go binary sizes down. Using more RSS can still cause some problems. But the impact that the larger binary actually has on our practical system operation is not as bad as it looks.
From an OpenTelemetry perspective, as a user of the Collector looking at this you might be wondering whether this means you’re safe to use contrib or if you should still pursue building a custom collector. There remain great reasons not to use contrib:
- Larger binary/image takes more disk space
- More components = more dependencies = more threat space for vulnerability scanners to yell at you :)
- There can be some negative effects to the RSS overhead of the larger binary
But overall, even despite some of my previous public statements that the increased memory overhead of contrib is really bad, after looking much deeper into it and understanding Linux kernel memory management more, I understand that it is not as severe as it looks and as I may have previously made it out to be.
Optional Colour
Branching explanations of things that didn’t fit nicely into the overall investigation.
ELF Binary Structure
We can understand more information about those initial binary mappings in the pmap output by understanding a bit more about the ELF (Executable and Linkable Format) binary format. The readelf(1) tool can give us a nice readable output that can help us understand more clearly. From that output, let’s look at the two most relevant sections when running readelf -a otelcol-contrib
Program Headers:
  Type           Offset             VirtAddr           PhysAddr
                 FileSiz            MemSiz              Flags  Align
  PHDR           0x0000000000000040 0x0000000000400040 0x0000000000400040
                 0x0000000000000150 0x0000000000000150  R      0x1000
  NOTE           0x0000000000000f78 0x0000000000400f78 0x0000000000400f78
                 0x0000000000000064 0x0000000000000064  R      0x4
  LOAD           0x0000000000000000 0x0000000000400000 0x0000000000400000
                 0x0000000009770691 0x0000000009770691  R E    0x1000
  LOAD           0x0000000009771000 0x0000000009b71000 0x0000000009b71000
                 0x000000000b225688 0x000000000b225688  R      0x1000
  LOAD           0x0000000014997000 0x0000000014d97000 0x0000000014d97000
                 0x000000000056df80 0x000000000060b3c0  RW     0x1000
  GNU_STACK      0x0000000000000000 0x0000000000000000 0x0000000000000000
                 0x0000000000000000 0x0000000000000000  RW     0x8

 Section to Segment mapping:
  Segment Sections...
   00
   01     .note.go.buildid
   02     .text .note.gnu.build-id .note.go.buildid
   03     .rodata .typelink .itablink .gosymtab .gopclntab
   04     .go.buildinfo .go.fipsinfo .noptrdata .data .bss .noptrbss
   05

There is no dynamic section in this file.

There are no relocations in this file.
The crucial information here are the 3 LOAD sections, and the respective Segment Sections 02, 03, and 04 that gives information about what sections from the binary end up in each segment. The LOAD sections are what the process will load into memory. You can see the PhysAddr values for each of these mappings are exactly the same as the mappings from the pmap output. The Section to Segment mappings then tell us what exactly is in each of those sections. In 02, the 0x400000 segment, we can see the .text section. This is where the actual CPU instructions are, hence it living in a section with the R E (Read and Execute) flags that get mapped to r-x mode when mapped by the process. In 03, the 0x9b71000 segment, it has the .rodata (read-only data) section which is where all constant data ends up. It also contains a couple interesting Go-specific sections, like the .gopclntab which I’ll discuss shortly. In 04, the 0x14d97000 segment, we have the .data and .bss sections. The .data section contains non-constant data that is known at compile-time, i.e. something like var x int = 0 at the top of a file would make it to this section because it’s initialized and thus known compile-time. The .bss section is where known uninitialized data will go, such as var x int without being set. These go in the writeable section because the program may end up changing the values of data from this segment.
Further elaborating on the .gopclntab, this is the Program Counter Line Table. This is a table of program counter values (program counter being an address of an instruction the program could be running) to source information from the original Go code used to compile the binary. Have you ever wondered how even a binary stripped of symbols via ldflags="-s -w" still produces a backtrace to actual source locations when panicing? It’s because no matter what, this section of the binary is always kept intact. The runtime uses it for various things, but the panic backtrace is the most obvious one. You can see some more discussion about this in golang/go#36555 where the option to not write symbols to the pclntab was requested and rejected.
The two most obvious ways that a Go binary grows when adding more dependencies is partially that more code = more instructions, and partially that more code = more symbols to write to the pclntab. This means that a collector with more components grows substantially in both of these sections.
pprof Heap Analysis
The direct heap analysis reveals some interesting things, but nothing all that substantially exciting.
Looking at the heap profile for otelcol first:
$ go tool pprof http://localhost:1778/debug/pprof/heap
Fetching profile over HTTP from http://localhost:1778/debug/pprof/heap
Saved profile in /home/braydonk_google_com/pprof/pprof.otelcol.alloc_objects.alloc_space.inuse_objects.inuse_space.002.pb.gz
File: otelcol
Build ID: 785743821d9ac664638f9342e4270b2bdbcef397
Type: inuse_space
Time: 2026-02-06 03:14:43 UTC
Entering interactive mode (type "help" for commands, "o" for options)
(pprof) top
Showing nodes accounting for 4121.87kB, 100% of 4121.87kB total
Showing top 10 nodes out of 34
      flat  flat%   sum%        cum   cum%
 1536.51kB 37.28% 37.28%  1536.51kB 37.28%  go.uber.org/zap/zapcore.newCounters (inline)
 1024.28kB 24.85% 62.13%  1024.28kB 24.85%  k8s.io/api/core/v1.init
  532.26kB 12.91% 75.04%   532.26kB 12.91%  github.com/xdg-go/stringprep.map.init.2
  516.76kB 12.54% 87.58%   516.76kB 12.54%  runtime.procresize
  512.05kB 12.42%   100%   512.05kB 12.42%  runtime.(*scavengerState).init
         0     0%   100%  1536.51kB 37.28%  github.com/spf13/cobra.(*Command).Execute
         0     0%   100%  1536.51kB 37.28%  github.com/spf13/cobra.(*Command).ExecuteC
         0     0%   100%  1536.51kB 37.28%  github.com/spf13/cobra.(*Command).execute
         0     0%   100%   532.26kB 12.91%  github.com/xdg-go/stringprep.init
         0     0%   100%   768.26kB 18.64%  go.opentelemetry.io/collector/exporter.(*factory).CreateLogs
As we can see, the heap profile is only accounting for 4kB of inuse_space. This is because, as the rest of the article explains, the Go heap itself is only a small proportion of the RSS of the program. In here the top node is from zapcore, likely the result of different components setting up zap loggers, as well as things from package init, which is allocation that happens as a result of the package being imported at all (either allocations that happen in global variables, or in explicit func init()s).
We did see through our analysis that otelcol-contrib uses more RssAnon, so it might have more heap space allocated. Is that the case?
$ go tool pprof http://localhost:1777/debug/pprof/heap
Fetching profile over HTTP from http://localhost:1777/debug/pprof/heap
Saved profile in /home/braydonk_google_com/pprof/pprof.otelcol-contrib.alloc_objects.alloc_space.inuse_objects.inuse_space.002.pb.gz
File: otelcol-contrib
Build ID: 3cd07bf5097963927ede2748cc4538b224f3906a
Type: inuse_space
Time: 2026-02-06 03:22:14 UTC
Entering interactive mode (type "help" for commands, "o" for options)
(pprof) top
Showing nodes accounting for 11801.29kB, 63.79% of 18501.38kB total
Showing top 10 nodes out of 143
      flat  flat%   sum%        cum   cum%
 2609.95kB 14.11% 14.11%  2609.95kB 14.11%  regexp/syntax.(*compiler).inst
 2561.41kB 13.84% 27.95%  2561.41kB 13.84%  github.com/aws/aws-sdk-go/aws/endpoints.init
 1064.52kB  5.75% 33.70%  1064.52kB  5.75%  google.golang.org/protobuf/reflect/protoregistry.(*Files).RegisterFile.func2
    1027kB  5.55% 39.26%     1027kB  5.55%  google.golang.org/protobuf/internal/filedesc.(*File).initDecls (inline)
 1025.88kB  5.54% 44.80%  1025.88kB  5.54%  regexp.onePassCopy
 1024.47kB  5.54% 50.34%  2051.47kB 11.09%  google.golang.org/protobuf/internal/filedesc.newRawFile
  768.26kB  4.15% 54.49%   768.26kB  4.15%  go.uber.org/zap/zapcore.newCounters
  655.29kB  3.54% 58.03%   655.29kB  3.54%  runtime.itabsinit
  532.26kB  2.88% 60.91%   532.26kB  2.88%  github.com/DataDog/viper.(*Viper).SetKnown
  532.26kB  2.88% 63.79%   532.26kB  2.88%  github.com/vmware/govmomi/vim25/types.Add
It is! Around 14kB more in total. I can’t exactly pretend that difference is anything to get that worked up about though. However it is interesting to note that the difference is a result of us having more dependencies in our binary. I’d have to dig further into the profile to see which package is precompiling regexes that isn’t present in otelcol, but the aws/endpoints.init is pretty dead obvious that the AWS SDK that backs the AWS exporters has some allocations either in a func init or in global variables. You can also see DataDog, vmware, and more represented in this snippet.
But hey, we didn’t configure any of those components in our test config, why are these package inits happening? We’re not gonna use the AWS stuff, so those allocations are a total waste for us. When the Collector starts up, it takes a registry of all components it was built with and needs to initialize all the component factories so that they can be instantiated in the case that they are configured. This means there’s no avoiding the fact that these packages are unfortunately imported on Collector startup whether we asked for the relevant components or not.
Sources
Following are the most important resources that I either pulled information from directly for this article, or that more deeply explain things I went over here:
- Official Kernel docs on memory management, most of the page reclaim info came from here: https://docs.kernel.org/admin-guide/mm/concepts.html
- The Linux Memory Manager by Lorenzo Stoakes, which I have been reading an early access copy of and loving: https://nostarch.com/linux-memory-manager
- I linked it in-place, but repeated here for posterity the Wikipedia page on Thrashing explains the concept pretty well: https://en.wikipedia.org/wiki/Thrashing_(computer_science)
mmap(2)man page which explains the different parameters that can be used when mapping a page: https://man7.org/linux/man-pages/man2/mmap.2.htmlproc_pid_status(5)man page which explains what/proc/[pid]/statusfields mean: https://man7.org/linux/man-pages/man5/proc_pid_status.5.html- Other man pages referenced are linked in the spots I bring them up
- I sort of cut it out of the article, but this issue was great reading to see more about Go’s heap allocation strategy. And it made me learn a fun new feature of Go 1.26, which is that the
0xc000000000special address where the heap always starts today can be randomized through an experiment. Neat! https://github.com/golang/go/issues/27583